It was two days before Christmas, and…
What is wrong with these illustrations?
As the year 2016 winds down, I feel moved to attempt a graphic comparison of two weather observations I find extraordinary when viewed together. I’m sure there are many technical problems with the images that professional illustrators can find and gleefully point out. However, that’s not at all what I mean when I invite you to find what’s wrong here.
Figure 1a. Globe showing temperatures, centered on the North Pole (= small green circle at 90.0° N, 0.00° E). The temperatures indicated are for 2 PM UTC on 23 December, 2016. The temperature at a buoy about 90 miles from the North Pole registered a temperature of -4.0 °C (24.8 °F).
Figure 1b. Globe showing temperatures, centered on Wilsall, Montana, where I am writing this essay (= small green circle at 45.99° N, 110.66°W ). The temperatures indicated are for 3 PM UTC on 23 December, 2016, roughly one hour after the data in the North Pole illustration were gathered. The temperature at my weather station registered a temperature of -19.3 °C (-3.1°F)
What is wrong with these images is that the North Pole is about 20 degrees F. warmer than where I live in the western Lower 48 States, and that temperature difference has occurred three times this winter, once in November, and twice about a week apart in December.
Actually it got so warm in both November and December of 2016 that the temperature reached above 5 degrees F. at the North Pole. In December, the entire Arctic region North of 80 degrees is an area roughly the size of the Lower 48 U.S. states, had a sharp temperature spike reaching levels 30-35 degrees F (nearly 20 Celsius above normal). Meteorologists reviewing historical records back to 1958, cannot find a more intense anomaly – except a similar spike just five weeks ago.
Weather models had predicted temperatures could get this warm and the monitoring buoy, part of the North Pole Environmental Observatory, provides validation.
Polar Melting
Near the Franz Joseph Islands east of Svalbard, satellite imagery shows a large mass of ice vanishing over the last day. “It seems likely areas very close to or at the North Pole were at the freezing point” Thursday, said Zachary Labe, a doctoral student researching Arctic climate and weather at the University of California at Irvine. “This is pretty dramatic,” he tweeted.
While 1-day satellite obs for #seaice are noisy, this is a pretty dramatic retreat in the last 24 hours near the Franz Joseph Islands pic.twitter.com/roMgqabNCc
— Zack Labe (@ZLabe) December 22, 2016
Data from the National Snow and Ice Data Center indicate on the 22 of December the Arctic lost about 57,000 square miles of ice or about 148,000 square kilometers, an area roughly the size of Illinois. Labe cautioned, however, these ice loss data are preliminary and require quality control.
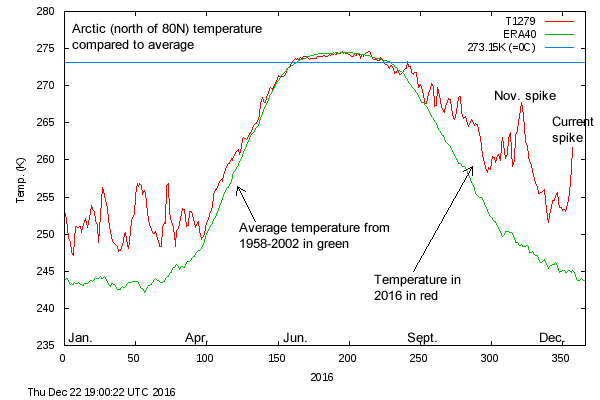
Temperature compared to normal in Arctic north of 80N latitude. (Danish Meteorological Institute)
Consider the average temperature in this large region is about minus-20 degrees F (-29 Celsius) at this time of year, but had shot up to 12 F on 22 December 2016.
In Longyearbyen, Norway, which is on the island of Svalbard in the Nordic Seas, the high reached 36 degrees last Thursday, according to Weather Underground, beating the old daily record of 33 degrees. Although it is common for large storms to transport large quantities of heat into the high Arctic, inducing large temperature swings, the intensity of warmth — more than 40 degrees above normal — has caught the attention of scientists.
This is the second time in the past five weeks such a steep rise in temperatures has occurred. In mid-November, temperatures averaged over the high Arctic were also about 30-35 degrees above normal.
(The North Pole is an insane 36 degrees warmer than normal as winter descends)
An analysis from Climate Central, a nonprofit science organization, found that a warm event of comparable intensity to what occurred in November “would have been extremely unlikely in a climate of a century ago” before heat-trapping gases in the atmosphere had grown to current levels.
The changes in weather patterns as result of the Arctic and North Temperate regions becoming more similar in temperatures, are resulting in peculiar changes in the jet streams, allowing warm tropical air to be blown north in the Arctic. This coupled with other changes in the north has resulted in the greatest change seen since the mid-1950s occurring in the far north. It is likely that the Arctic ice pack will continue to decrease with even alacrity. As the warmth in north has increased, it is thawing the permafrost and frozen soil resulting in the release of methane at even more rapid rate. Near the end of summer last year, the atmosphere methane concentration in the arctic was more than twice what it was 3 years ago. This, of course, is a positive feedback loop and will result in even more greenhouse gas releases.
A Runaway Train
In the terrestrial Arctic, the release of greenhouse gases is largely dependent on the action of bacteria in the huge masses of decaying organic material found in soil. This layer of decaying organic matter is often hundreds of meters thick, and has the potential to release immense amounts of carbon dioxide and methane. However, the organic materials that could rot are frozen rock-solid in permafrost and the bacteria that could cause the rotting is equally frozen and not metabolizing.
The warming rate due to increases in greenhouse gases in the polar regions is greater than any other ecosystem. This has resulted in a significant amount of bacterially-driven decomposition (aka “rotting”) through the summer. Increases in Arctic temperatures are largely the result of absorption of solar radiation in the soil mass and this is driven by the removal of the white reflective snow layer.
- Once the snow melts or sublimates, the newly exposed dark soil absorbs sunlight and rapidly heats up.
- This causes an increase in bacterial metabolism.
- This, in turn, releases more carbon dioxide and methane.
- This, in turn, causes localized heating.
- This, in turn, causes snow melting or sublimation, exposing the soil.
This is a positive feedback loop; once started, it can continue indefinitely provided the conditions that allowed it to start keep occurring.
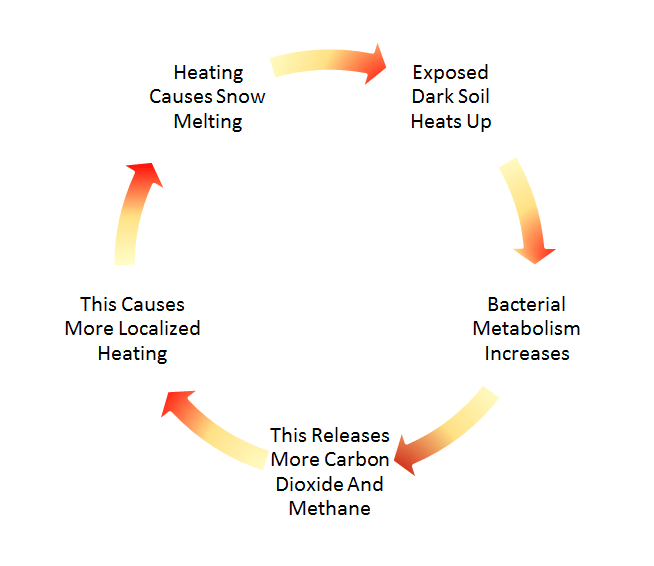
The positive feedback loop in diagram form.